UK › Scotland › Fife · council area · area statistics
What homes cost in Fife.
£179,134 on average in July 2026 – +5.4% in a year and +52.9% in ten, with 6,829 sales registered in twelve months. It ranks 18 of Scotland’s 32 council areas by price.
Official area statistics: the UK House Price Index, the ONS’s private rents and the Scottish register of energy certificates. VERA PI shows no individual sale in Scotland – why, below.
Prices
The price, month by month.
£179,134 was the average price of a home in Fife in July 2026 – +5.4% in a year, +52.9% in ten. It ranks 18 of Scotland’s 32 council areas; Scotland’s average was £196,349.
Average price, Fife and Scotland
Monthly, January 2004 – July 2026. The UK HPI’s average is a mix-adjusted measure, not a median of sales.
- Fife
- Scotland
UK House Price Index, HM Land Registry and Registers of Scotland (Open Government Licence v3.0), July 2026 release; monthly, January 2004 – July 2026.
- Fife
- Scotland
UK House Price Index, HM Land Registry and Registers of Scotland (Open Government Licence v3.0), July 2026 release; monthly, January 2004 – July 2026.
By property type
Average price of each type, monthly.
- Detached
- Semi-detached
- Terraced
- Flats
UK House Price Index, HM Land Registry and Registers of Scotland (Open Government Licence v3.0), July 2026 release; monthly, January 2004 – July 2026.
- Detached
- Semi-detached
- Terraced
- Flats
UK House Price Index, HM Land Registry and Registers of Scotland (Open Government Licence v3.0), July 2026 release; monthly, January 2004 – July 2026.
Each type, July 2026
The average price and its change.
| Type | Average | 1 yr | 5 yrs | 10 yrs |
|---|---|---|---|---|
| Detached | £346,998 | +5.7% | +24.3% | +57.5% |
| Semi-detached | £205,947 | +6.6% | +26.2% | +59.2% |
| Terraced | £163,356 | +6.7% | +25.6% | +58.1% |
| Flats | £110,150 | +2.8% | +14.6% | +38.7% |
Council areas
Among Scotland’s 32 council areas.
The average price in July 2026, its change over one, five and ten years, and the yearly average since 2004. Each opens on its own page.
| Council area | Average | 1 yr | 5 yrs | 10 yrs | 2004 – |
|---|---|---|---|---|---|
| East Renfrewshire1,672 sales in twelve months | £305,723 | +6.3% | +22.0% | +45.2% | |
| City of Edinburgh10,851 sales in twelve months | £303,965 | +4.0% | +15.4% | +57.4% | |
| Midlothian2,075 sales in twelve months | £283,166 | +1.2% | +14.9% | +49.9% | |
| East Lothian2,577 sales in twelve months | £282,500 | −1.0% | +10.1% | +45.5% | |
| East Dunbartonshire1,783 sales in twelve months | £271,608 | +6.2% | +20.5% | +47.0% | |
| Stirling1,795 sales in twelve months | £239,034 | +2.5% | +21.9% | +53.9% | |
| Perth and Kinross3,123 sales in twelve months | £229,180 | −1.4% | +18.1% | +46.7% | |
| West Lothian3,658 sales in twelve months | £227,354 | +2.3% | +22.6% | +56.4% | |
| Highland4,179 sales in twelve months | £221,136 | +6.1% | +20.2% | +45.7% | |
| Orkney Islands324 sales in twelve months | £214,106 | −0.3% | +24.8% | +75.3% | |
| Aberdeenshire4,361 sales in twelve months | £204,894 | +0.7% | +3.0% | −0.8% | |
| Moray1,717 sales in twelve months | £204,008 | +5.6% | +21.8% | +46.4% | |
| City of Glasgow11,156 sales in twelve months | £193,675 | +2.6% | +24.7% | +66.4% | |
| Scottish Borders2,001 sales in twelve months | £193,050 | +4.5% | +20.1% | +49.3% | |
| Argyll and Bute1,673 sales in twelve months | £189,366 | +3.1% | +23.9% | +54.2% | |
| South Lanarkshire6,664 sales in twelve months | £185,267 | +4.1% | +26.6% | +57.2% | |
| Shetland Islands261 sales in twelve months | £179,493 | −7.0% | +12.3% | +22.9% | |
| Fife6,829 sales in twelve months | £179,134 | +5.4% | +22.4% | +52.9% | |
| Angus2,090 sales in twelve months | £178,455 | +5.1% | +15.7% | +32.4% | |
| Falkirk2,772 sales in twelve months | £173,046 | +4.9% | +23.9% | +59.0% | |
| South Ayrshire2,294 sales in twelve months | £171,905 | +8.5% | +17.2% | +44.1% | |
| Dumfries and Galloway2,543 sales in twelve months | £169,511 | +4.6% | +21.6% | +52.7% | |
| Clackmannanshire884 sales in twelve months | £166,005 | −2.7% | +16.6% | +52.2% | |
| Renfrewshire3,945 sales in twelve months | £159,992 | −1.3% | +21.6% | +51.0% | |
| North Lanarkshire5,423 sales in twelve months | £158,591 | +3.6% | +25.8% | +55.1% | |
| City of Dundee2,757 sales in twelve months | £146,924 | +3.8% | +11.2% | +29.2% | |
| North Ayrshire2,934 sales in twelve months | £143,560 | +5.2% | +27.3% | +52.8% | |
| Na h-Eileanan Siar350 sales in twelve months | £139,518 | +6.7% | +8.7% | +34.9% | |
| East Ayrshire2,230 sales in twelve months | £138,971 | +7.2% | +32.6% | +54.8% | |
| City of Aberdeen5,065 sales in twelve months | £130,689 | −8.7% | −17.0% | −33.0% | |
| West Dunbartonshire1,549 sales in twelve months | £127,521 | +4.7% | +19.4% | +49.6% | |
| Inverclyde1,291 sales in twelve months | £115,401 | +5.4% | +17.4% | +34.1% |
Rents
What a home rents for.
A private rent in Scotland averaged £1,013 a month in August 2026 (+1.1% in a year). The ONS publishes Scotland’s rents for 18 broad rental market areas, not for council areas – they are listed below.
Average monthly rent, Scotland
January 2015 – August 2026.
Price Index of Private Rents, Office for National Statistics (Open Government Licence v3.0), January 2015 – August 2026.
Price Index of Private Rents, Office for National Statistics (Open Government Licence v3.0), January 2015 – August 2026.
By size and type, August 2026
| Home | A month | In a year |
|---|---|---|
| All private rents | £1,013 | +1.1% |
| One bedroom | £702 | +2.8% |
| Two bedrooms | £911 | +1.8% |
| Three bedrooms | £1,172 | +1.4% |
| Four bedrooms or more | £1,941 | +1.0% |
| Detached | £1,555 | −1.3% |
| Semi-detached | £1,077 | +0.9% |
| Terraced | £1,004 | +0.4% |
| Flat or maisonette | £840 | +2.0% |
By broad rental market area
The ONS’s 18 areas for Scotland, August 2026.
| Area | All homes | Two bedrooms | 1 yr |
|---|---|---|---|
| Lothian | £1,415 | £1,324 | +1.6% |
| Greater Glasgow | £1,266 | £1,089 | +1.3% |
| East Dunbartonshire | £1,171 | £957 | +5.4% |
| West Dunbartonshire | £940 | £762 | +3.6% |
| West Lothian | £911 | £836 | +9.0% |
| South Lanarkshire | £893 | £741 | +1.3% |
| Forth Valley | £892 | £822 | +2.4% |
| Aberdeen and Shire | £845 | £776 | −0.5% |
| Fife | £832 | £738 | +1.5% |
| Dundee and Angus | £825 | £750 | +0.3% |
| Argyll and Bute | £822 | £754 | −1.6% |
| North Lanarkshire | £801 | £667 | −3.5% |
| Renfrewshire/Inverclyde | £800 | £673 | −1.5% |
| Highland and Islands | £739 | £713 | +4.3% |
| Perth and Kinross | £739 | £679 | +0.7% |
| Scottish Borders | £708 | £629 | −2.4% |
| Ayrshires | £643 | £595 | +2.0% |
| Dumfries and Galloway | £558 | £564 | +6.6% |
Energy
How Fife’s homes are rated.
The latest energy certificate at each of 123,397 OS references in Fife, from the Scottish register (2008 – 2026-06): 51.8% rated A to C. Observations of the register, not a count of homes; a reported floor area is not the area at a sale.
Energy efficiency bands
The share of the latest certificates in each band, A (best) to G.
Reported floor area
The median of the latest certificates, by the register’s property type.
| Flat | 64 m² | 37,480 |
| House | 90 m² | 65,132 |
| Bungalow | 77 m² | 17,706 |
| Maisonette | 79 m² | 3,038 |
| Park home | 68 m² | 41 |
Tenure on the certificate
- Owner-occupied64% · 78,876
- Rented (social)25% · 30,613
- Rented (private)9% · 11,418
- Unknown2% · 2,490
Domestic Energy Performance Certificates, Scottish Government (Open Government Licence v3.0) – 3,787,063 accepted observations; here the latest certificate per OS reference.
What VERA PI does not show here, and why
- No individual sale. Scotland's register of sales is kept by Registers of Scotland; VERA PI has not acquired its sale-level data, so no address, no price paid and no buyer or seller is shown – only the official averages of the UK House Price Index.
- No address file, no estimate, no plot outline, no planning or flood answer for a Scottish home – those need the sale-level data and boundaries VERA PI does not hold here.
- No Census figures: no Scotland Census package is delivered.
- Energy certificates are shown as area aggregates of the register's observations – the latest certificate at each OS reference – never as a home's certificate, and a reported floor area is not the area at a sale.
Sources and licences
Every figure, and where it comes from.
Every figure carries its period. The averages are official statistics of the bodies named; nothing here is a valuation of a home or legal advice.
- HM Land Registry, ONS, Registers of Scotland, Land & Property Services NI – UK House Price Index, full fileJuly 2026 release (data to the month stated in each row)Open Government Licence v3.0 · Contains HM Land Registry data © Crown copyright and database right 2026. This data is licensed under the Open Government Licence v3.0. · www.gov.uk/government/statistical-data-sets/uk-house-price-index-data-downloads-july-2026
- Office for National Statistics – income estimates for small areas (FYE2023, MSOA) and Price Index of Private Rents (to August 2026); ONS LSOA21→MSOA21→LAD22 look-upincome FYE2023 · rents Jan 2015 – Aug 2026 · [x] and [z] kept as the source writes themOpen Government Licence v3.0 · Source: Office for National Statistics licensed under the Open Government Licence v.3.0. · www.ons.gov.uk
- Scottish Government – Domestic Energy Performance Certificates register (non-address extract, 2008 – Q2 2026)3,787,063 accepted observations; the latest per OS reference hereOpen Government Licence v3.0 · Contains Scottish Government data licensed under the Open Government Licence v3.0. · statistics.gov.scot/data/domestic-energy-performance-certificates
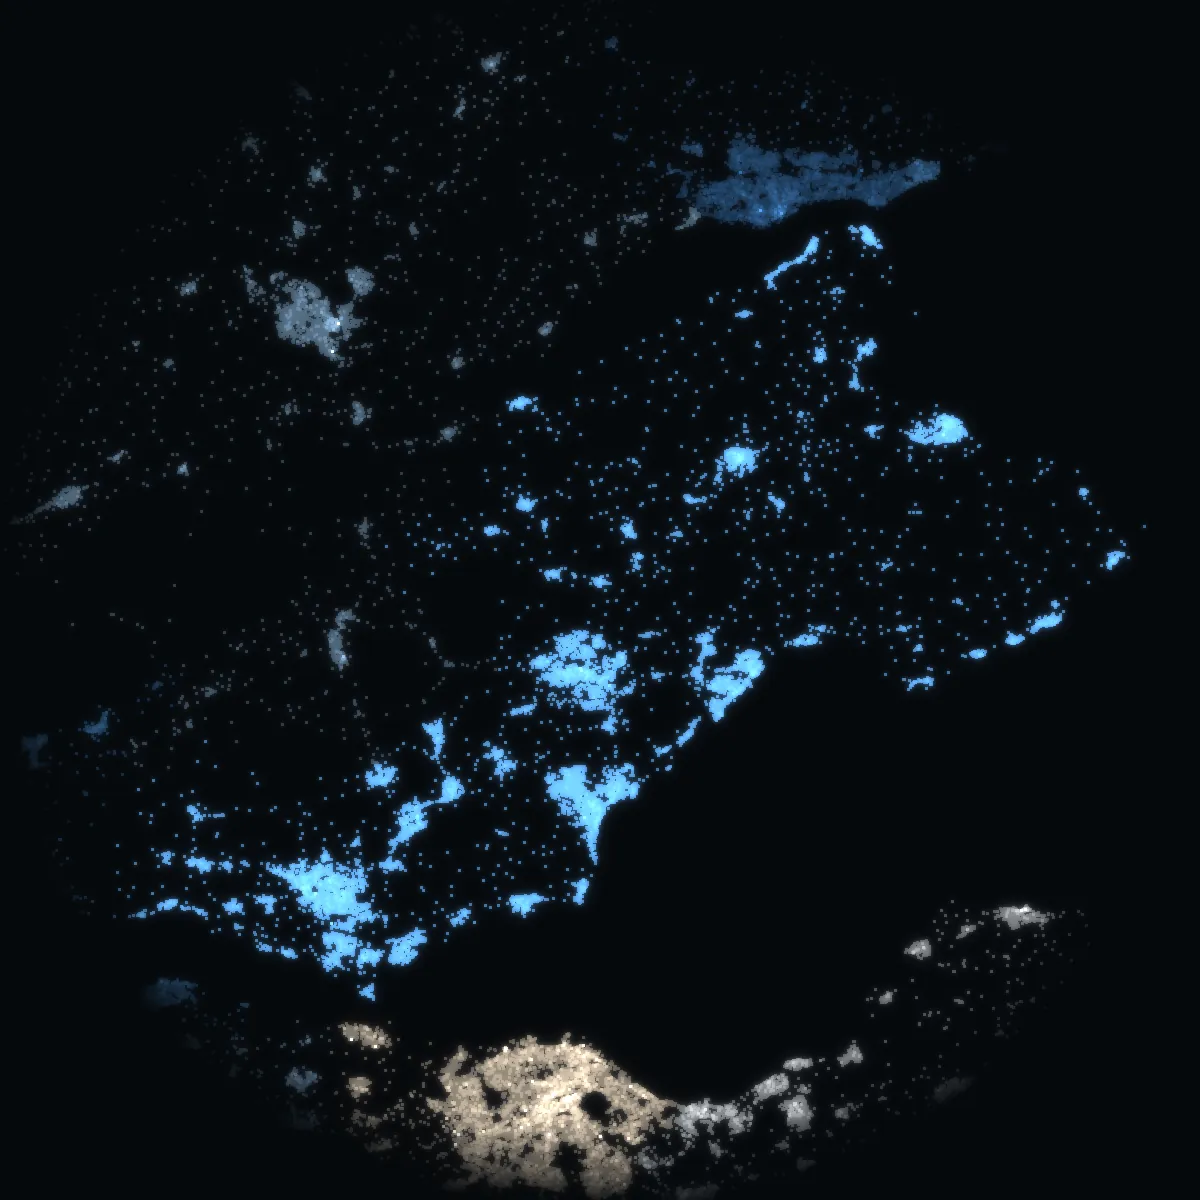
- Ordnance Survey – Code-Point Open (postcode points, for the night picture only)2026Open Government Licence v3.0 · Contains OS data © Crown copyright and database right 2026; Royal Mail data © Royal Mail copyright and database right 2026; National Statistics data © Crown copyright and database right 2026. · www.ordnancesurvey.co.uk/products/code-point-open