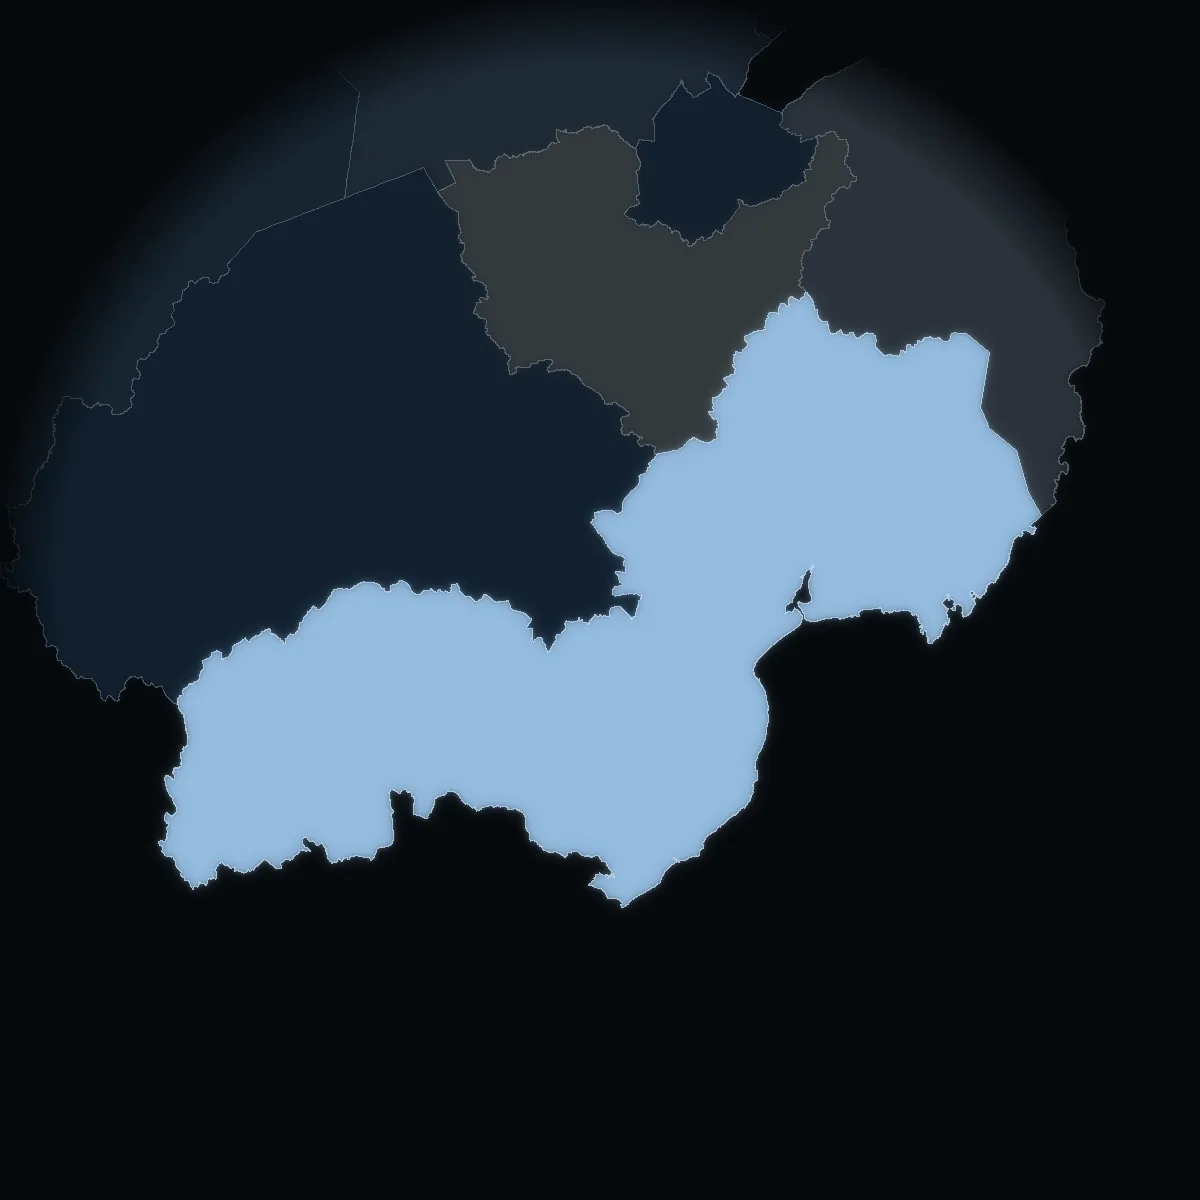
UK › Northern Ireland › Newry, Mourne and Down · local government district · official statistics
What homes cost in Newry, Mourne and Down.
£220,572 for a typical home in Q2 2026 – +12.8% in a year and +86.0% in ten, with 1,722 verified sales in four quarters.
Official statistics of Land & Property Services and NISRA, and the ONS’s private rents. Northern Ireland publishes no individual sale – why, below.
Prices
The price, quarter by quarter.
The standardised price of a home in Newry, Mourne and Down was £220,572 in Q2 2026 – +12.8% in a year, +86.0% in ten. It ranks 3 of Northern Ireland’s 11 districts; Northern Ireland’s was £202,487.
Standardised price, Newry, Mourne and Down and Northern Ireland
Quarterly, Q1 2005 – Q2 2026. The price of a typical home the index holds constant – not a median of sales.
- Newry, Mourne and Down
- Northern Ireland
Northern Ireland House Price Index, Land & Property Services / NISRA (Open Government Licence v3.0), Q2 2026, frozen 19 August 2026; quarterly since Q1 2005; index Q1 2023 = 100.
- Newry, Mourne and Down
- Northern Ireland
Northern Ireland House Price Index, Land & Property Services / NISRA (Open Government Licence v3.0), Q2 2026, frozen 19 August 2026; quarterly since Q1 2005; index Q1 2023 = 100.
Inside the district
Newry, Mourne and Down, 2025.
The median of the year’s verified sales by type, and by District Electoral Area – the official annual statistics, never a single sale.
Median by type, 2025
| 2025 | Median | Lower – upper quartile | Verified sales |
|---|---|---|---|
| All sales | £205,000 | £157k – £275k | 1,750 |
| Detached | £300,000 | £240k – £375k | 673 |
| Semi-detached | £200,000 | £173k – £226k | 577 |
| Terraced | £139,000 | £115k – £170k | 358 |
| New dwellings | £231,000 | £195k – £290k | 198 |
| Existing dwellings | £200,000 | £150k – £268k | 1,552 |
| Urban | £197,000 | £141k – £255k | 873 |
| Rural | £215,000 | £175k – £303k | 877 |
The median, year by year
Local Government District annual price statistics, Land & Property Services (Open Government Licence v3.0).
Local Government District annual price statistics, Land & Property Services (Open Government Licence v3.0).
By District Electoral Area, 2025
All verified sales; the change is against five years earlier.
| Electoral area | Median | Sales | 5 yrs |
|---|---|---|---|
| Crotlieve | £235,000 | 200 | +42.4% |
| Slieve Croob | £232,500 | 172 | +50.0% |
| Slieve Gullion | £216,225 | 178 | +41.8% |
| Rowallane | £208,725 | 308 | +39.1% |
| The Mournes | £206,250 | 340 | +42.2% |
| Downpatrick | £185,000 | 270 | +22.1% |
| Newry | £178,000 | 282 | +20.7% |
Districts
Among Northern Ireland’s 11 districts.
The standardised price in Q2 2026, its change, and the median of the year’s verified sales. Each opens on its own page.
| District | Price | 1 yr | 5 yrs | 10 yrs | Median, 2025 |
|---|---|---|---|---|---|
| Lisburn and Castlereagh2,300 verified sales in four quarters | £240,737 | +9.7% | +39.2% | +69.2% | £240,000 |
| Ards and North Down2,971 verified sales in four quarters | £227,275 | +7.0% | +36.8% | +68.4% | £211,000 |
| Newry, Mourne and Down1,722 verified sales in four quarters | £220,572 | +12.8% | +41.7% | +86.0% | £205,000 |
| Causeway Coast and Glens1,748 verified sales in four quarters | £218,871 | +9.6% | +36.2% | +90.1% | £198,000 |
| Antrim and Newtownabbey2,115 verified sales in four quarters | £206,120 | +8.8% | +39.0% | +72.0% | £192,000 |
| Fermanagh and Omagh998 verified sales in four quarters | £201,732 | +11.0% | +45.3% | +84.9% | £189,750 |
| Mid Ulster1,211 verified sales in four quarters | £195,453 | +10.5% | +43.8% | +74.5% | £190,000 |
| Derry City and Strabane1,360 verified sales in four quarters | £189,474 | +12.4% | +47.3% | +92.7% | £174,750 |
| Armagh City, Banbridge and Craigavon2,678 verified sales in four quarters | £186,993 | +9.2% | +40.0% | +70.4% | £182,000 |
| Belfast4,797 verified sales in four quarters | £184,768 | +7.7% | +33.9% | +64.4% | £173,500 |
| Mid and East Antrim1,917 verified sales in four quarters | £177,450 | +8.2% | +34.8% | +66.2% | £172,500 |
Rents
What a home rents for.
A private rent in Northern Ireland averaged £874 a month in June 2026 (+1.6% in a year); the ONS publishes Northern Ireland’s rents for the whole country, not by district.
Average monthly rent, Northern Ireland
Price Index of Private Rents, Office for National Statistics (Open Government Licence v3.0), to June 2026.
Price Index of Private Rents, Office for National Statistics (Open Government Licence v3.0), to June 2026.
By size and type
| Home | A month | In a year |
|---|---|---|
| All private rents | £874 | +1.6% |
| One bedroom | £621 | +2.8% |
| Two bedrooms | £764 | +2.1% |
| Three bedrooms | £875 | +1.4% |
| Four bedrooms or more | £1,223 | +0.7% |
| Detached | £1,086 | +0.7% |
| Semi-detached | £894 | +0.6% |
| Terraced | £822 | +1.5% |
| Flat or maisonette | £762 | +2.9% |
What VERA PI does not show here, and why
- No individual sale. Northern Ireland publishes its house prices as official statistics (Land & Property Services, Department of Finance) – a standardised price and index, verified sales counts and annual medians by area – never a sale with its address.
- No energy certificates: Northern Ireland's EPC data are not delivered.
- No height or terrain answer: the OSNI terrain model has no qualified contract here.
- No address file, no estimate, no plot outline for a Northern Irish home.
Sources and licences
Every figure, and where it comes from.
Every figure carries its period. The averages are official statistics of the bodies named; nothing here is a valuation of a home or legal advice.
- Land & Property Services / NISRA – Northern Ireland House Price Index and the annual ward, DEA and LGD price statisticsQ2 2026 (frozen 2026-08-19) · aggregated statistics, never individual sales · HPI 2023 Q1 = 100Open Government Licence v3.0 · Contains public sector information licensed under the Open Government Licence v3.0 (Land & Property Services, Department of Finance NI). · www.finance-ni.gov.uk/publications/ni-house-price-index-statistical-reports
- OSNI – Local Government Districts (2012), Open Data Largescale Boundaries2012 definition · in use from 2014 · published 2018 · file 2025 (kept apart)Open Government Licence v3.0 · © Crown copyright and database rights, OSNI (Land & Property Services) – Open Government Licence; no right to OSNI logos or maps. · www.opendatani.gov.uk
- Office for National Statistics – income estimates for small areas (FYE2023, MSOA) and Price Index of Private Rents (to August 2026); ONS LSOA21→MSOA21→LAD22 look-upincome FYE2023 · rents Jan 2015 – Aug 2026 · [x] and [z] kept as the source writes themOpen Government Licence v3.0 · Source: Office for National Statistics licensed under the Open Government Licence v.3.0. · www.ons.gov.uk