UK › East Midlands · 35 local authorities · live
Every sale in the East Midlands.
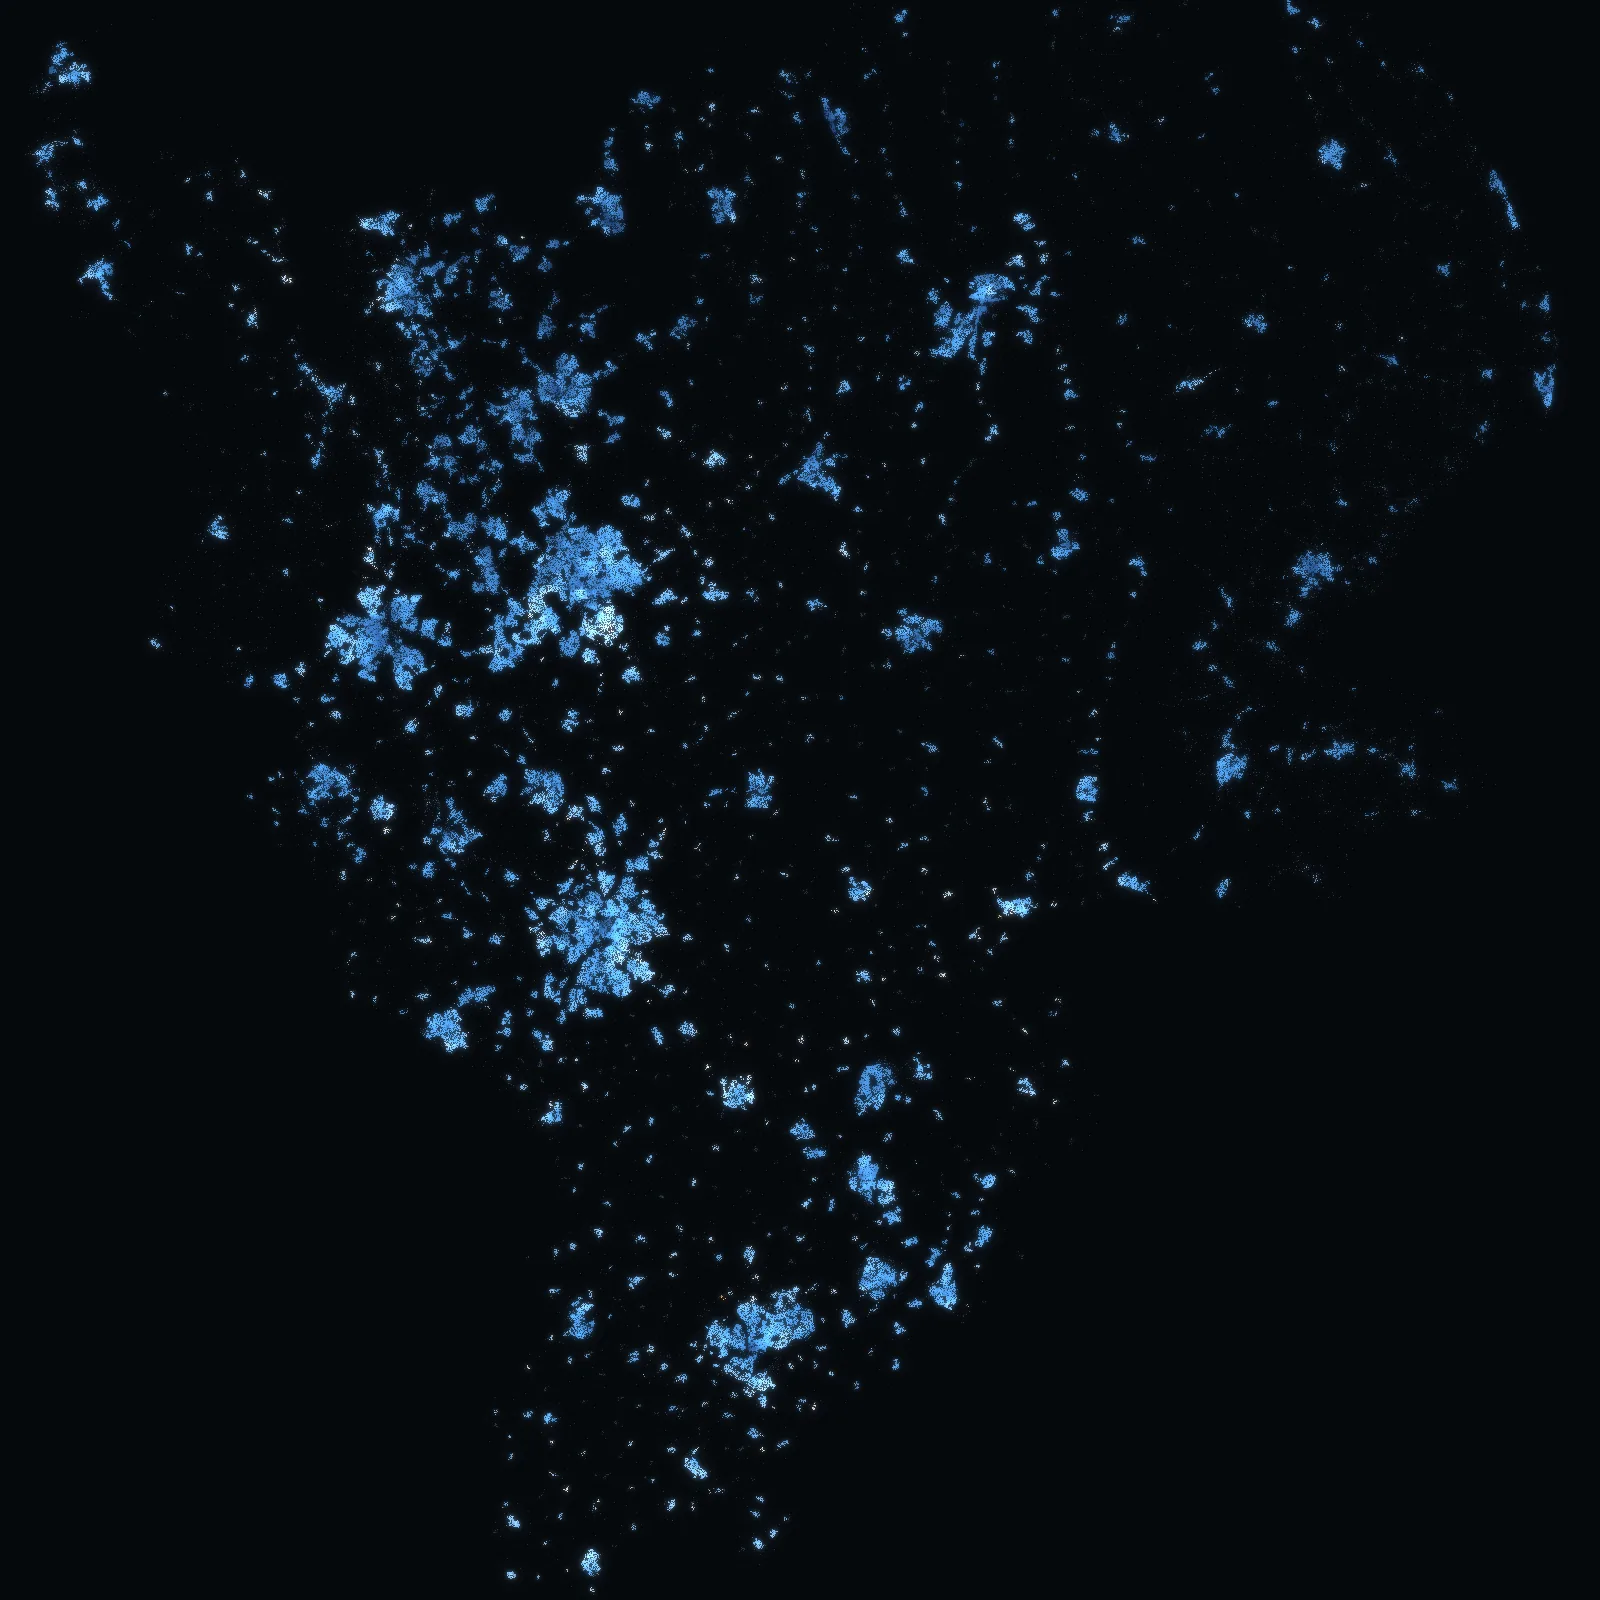
2,669,876 home sales in the East Midlands's 35 local authorities since 1995 – 391,397 of them since October 2021, at 1,388,505 addresses – homes at a median of £250k (standard sales 2023–2025), with every one of its 2,219,985 freehold plots on the map, authority by authority.
Each authority opens on its own map. Sales as HM Land Registry publishes them, January 1995 – August 2026, with the prices by year since 1995; the latest months fill in as sales are registered.
HM Land Registry · ONS · Ordnance Survey · the VERA PI databases. No owner names. Counted from the files of 28 September 2026.
Authority by authority · East Midlands
Pick an authority. Its map opens.
Every one of the East Midlands's 35 local authorities – its freehold plots and its addresses on the map, the median price of the homes sold around them, flats and houses apart, and its prices by year since 1995. Each has its own address to share.
- Local authorityWest Northamptonshire34,897 sales · 187,414 freehold plotsHomes £300k · flats £151k
- Local authorityNorth Northamptonshire30,415 sales · 162,021 freehold plotsHomes £265k · flats £134k
- Local authorityNottingham18,827 sales · 105,862 freehold plotsHomes £195k · flats £140k
- Local authorityDerby18,360 sales · 100,415 freehold plotsHomes £210k · flats £130k
- Local authorityLeicester15,013 sales · 110,414 freehold plotsHomes £240k · flats £130k
- Local authorityCharnwood14,183 sales · 80,872 freehold plotsHomes £275k · flats £138k
- Local authorityEast Lindsey12,949 sales · 81,837 freehold plotsHomes £218k · flats £104k
- Local authoritySouth Kesteven12,556 sales · 70,141 freehold plotsHomes £260k · flats £128k
- Local authorityAmber Valley11,601 sales · 65,178 freehold plotsHomes £235k · flats £134k
- Local authorityNewark and Sherwood11,389 sales · 63,610 freehold plotsHomes £237k · flats £120k
- Local authorityRushcliffe11,353 sales · 59,666 freehold plotsHomes £345k · flats £173k
- Local authorityBassetlaw11,207 sales · 60,459 freehold plotsHomes £205k · flats £105k
- Local authoritySouth Derbyshire10,868 sales · 57,382 freehold plotsHomes £260k · flats £130k
- Local authorityNorth Kesteven10,545 sales · 60,246 freehold plotsHomes £240k · flats £115k
- Local authorityGedling10,446 sales · 55,716 freehold plotsHomes £251k · flats £128k
- Local authorityAshfield10,303 sales · 57,853 freehold plotsHomes £195k · flats £115k
- Local authorityNorth West Leicestershire10,000 sales · 53,872 freehold plotsHomes £275k · flats £153k
- Local authorityHinckley and Bosworth9,803 sales · 57,766 freehold plotsHomes £263k · flats £125k
- Local authorityHarborough9,452 sales · 52,582 freehold plotsHomes £340k · flats £162k
- Local authorityWest Lindsey9,403 sales · 53,151 freehold plotsHomes £230k · flats £98k
- Local authorityBroxtowe8,967 sales · 50,453 freehold plotsHomes £250k · flats £160k
- Local authorityMansfield8,966 sales · 47,893 freehold plotsHomes £188k · flats £100k
- Local authorityErewash8,912 sales · 54,710 freehold plotsHomes £212k · flats £120k
- Local authoritySouth Holland8,871 sales · 53,592 freehold plotsHomes £238k · flats £88k
- Local authorityNorth East Derbyshire8,658 sales · 46,695 freehold plotsHomes £245k · flats £129k
- Local authorityChesterfield8,583 sales · 46,021 freehold plotsHomes £195k · flats £121k
- Local authorityHigh Peak8,069 sales · 41,634 freehold plotsHomes £260k · flats £160k
- Local authorityBolsover7,676 sales · 40,216 freehold plotsHomes £180k · flats £90k
- Local authorityBlaby7,578 sales · 47,223 freehold plotsHomes £275k · flats £147k
- Local authorityLincoln7,498 sales · 38,045 freehold plotsHomes £182k · flats £119k
- Local authorityDerbyshire Dales5,944 sales · 47,848 freehold plotsHomes £320k · flats £202k
- Local authorityBoston5,531 sales · 33,765 freehold plotsHomes £204k · flats £91k
- Local authorityMelton5,029 sales · 29,439 freehold plotsHomes £275k · flats £141k
- Local authorityOadby and Wigston4,129 sales · 23,751 freehold plotsHomes £280k · flats £125k
- Local authorityRutland3,270 sales · 22,243 freehold plotsHomes £345k · flats £163k
VERA PI · East Midlands
Three tools, one region.
The same operating system as in France, New York, Florida and Massachusetts, with HM Land Registry underneath: the address, what sold there and around it since 1995, its postcode and its local authority.
Check a price · East Midlands
Where does the asking price sit?
Pick an address, the kind of home and the asking price. VERA PI places the price among the standard sales of homes like it within 500 m – the median, the middle half, the share at or below it and how many sales stand behind them.
The method
Every published sale, at its address.
Every figure on these pages comes from the VERA PI databases: the sales HM Land Registry publishes, with their price, date, type, tenure and address; its own links between a sale and its UPRN; and the postcode directory and address points of the Office for National Statistics and Ordnance Survey – each with its version and date.
- HM Land Registry – Price Paid Data, the complete fileevery published residential sale in the East Midlands since 1 January 1995: price, transfer date, type, tenure, new build, address and category – 2,669,876 in all, 391,397 of them since 16 October 2021
- Office for National Statistics – ONS Postcode Directoryeach postcode's current local authority and region (August 2026) – how a sale is placed in the East Midlands and in its authority
- HM Land Registry – transaction to UPRN look-upits own links between a sale and its addressable location – new registrations from 2026, no backfill; a link that is not default-eligible, or a sale with two UPRNs, is never used
- Ordnance Survey – OS Open UPRN and Code-Point Openthe address points and the postcode centres (Code-Point Open 2026.3.0, OS Open UPRN September 2026)
- HM Land Registry – INSPIRE Index Polygonsthe indicative outline of every registered freehold title in the East Midlands – 2,219,985 plots from the files of its local authorities; an address sits on a plot only when its linked UPRN point lies inside the outline
No owner names, ever, and no buyer or seller. Sales are shown as counts and as medians of ten or more, with their period and radius; a category B sale (repossessions, buy-to-let mortgages, sales to companies) and the type «other» are never in a median. A sale sits on the map at its officially linked UPRN point, or at its postcode’s centre – an area for many addresses, never the building. The plot outlines are indicative (HM Land Registry’s general boundaries rule) and freehold only – a leasehold flat has no outline of its own; an address sits on a plot only when its linked UPRN point lies inside the outline, never by its postcode centre. Not in the East Midlands's file yet: energy certificates, VERA PI Estimate and Score, flood, planning, transport and neighbourhood context, lease length – each is shown as missing, never as a proxy. There is no price per m². The latest months are incomplete: a sale reaches the data weeks or months after it completes.
Contains HM Land Registry data © Crown copyright and database right 2026, licensed under the Open Government Licence v3.0. The polygons (including the associated geometry, namely x, y co-ordinates) are subject to Crown copyright and database rights 2026 Ordnance Survey AC0000851063. Source: Office for National Statistics licensed under the Open Government Licence v.3.0. Contains OS data © Crown copyright and database right 2026. Contains Royal Mail data © Royal Mail copyright and database right 2026. Contains National Statistics data © Crown copyright and database right 2026. Contains GeoPlace data © Local Government Information House Limited copyright and database right 2026. Map: © OpenStreetMap contributors, OpenFreeMap.